

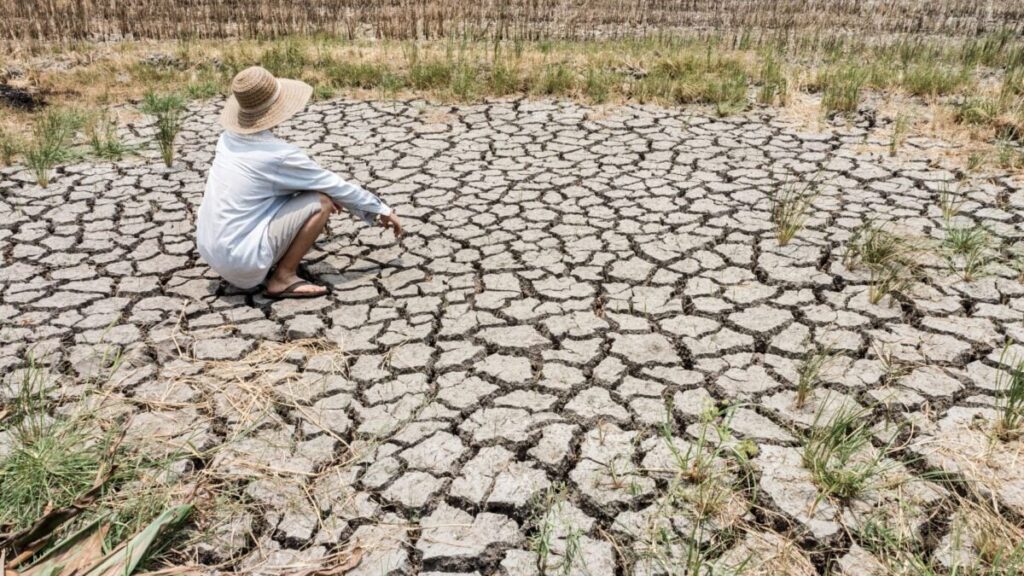
As the strongest El Niño on record unfolds over the coming months, many parts of the world will see drastic weather shifts. This phenomenon alters atmospheric circulation, temperatures, and precipitation patterns across the globe, and different regions will experience starkly different impacts.
To visualize these impacts, climatologist Zeke Hausfather combined projections from 13 dynamical climate models to create a map showing which parts of the world are likely to be hit hardest by El Niño. He notes that all incorporated models point to strong precipitation anomalies, as the many areas of drought and flood risk clearly show.
It’s important…
Read the full article at GIZMODO.COM